The challenges that Capgemini face are similar to those of many operating in the fluid and uncertain economic and social environment in which global organisations must now function. For a business with such reliance on human, knowledge and intellectual capital,there is a firm desire from the leadership teams to understand more about the workforce, and how they can be mobilised through HR activity, to increase the productivity and performance of the business.
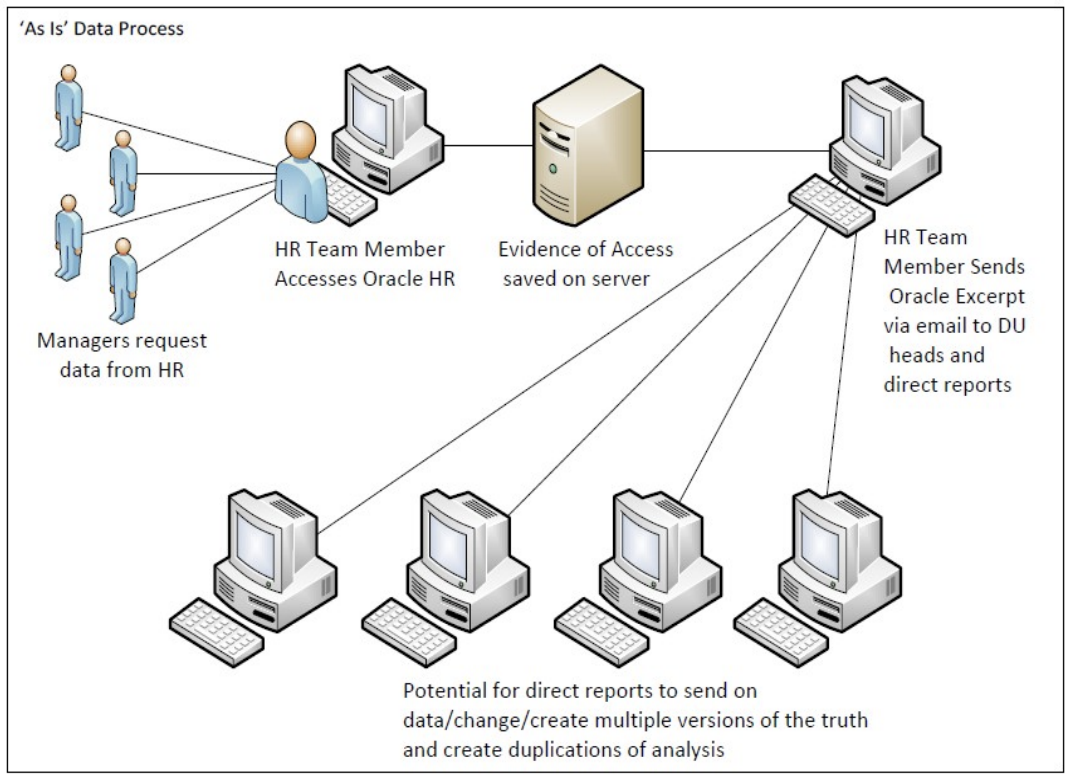
The business does, however, have to tackle some of the common challenges other businesses will recognise, not least the issue of siloed working, which can prevent teams from collaborating and working more productively together. Nowhere is this truer than in the HR function, where the different activities which the HR teams manage sit separately to one another with varying degrees of overlap and cohesion. This structural and functional separation of activity meant that the way teams connect and use data was also very different. Reporting was ad‐ hoc and piecemeal, and the language that the business used to speak about people concepts was equally disjointed (Figure 1).
Keen to draw value from the organisation’s extensive HR data estate, which was of good quality but siloed, HR Business Partner Maja Luckos saw the potential for an alternative approach at the CIPD HR Analytics Conference in 2014:
"We have always done the same thing, as have most organisations, which is to report on the past by producing static reports, using multiple data systems which are not integrated. As the systems are separate, we naturally report in silos; so L&D is reported separately, as is recruitment etc. Everything is collated monthly to review progress against our KPIs.
Everyone produces their own slide which tells a different story on headcount etc. So I saw the need to change this because at the end of the day we’re working as one organisation with one set of KPIs and one HR agenda. I really started thinking, “How can we pull it all together into one version of the truth?”.
Maja Luckos, HR Business Partner
Figure 1: Management of data before the change
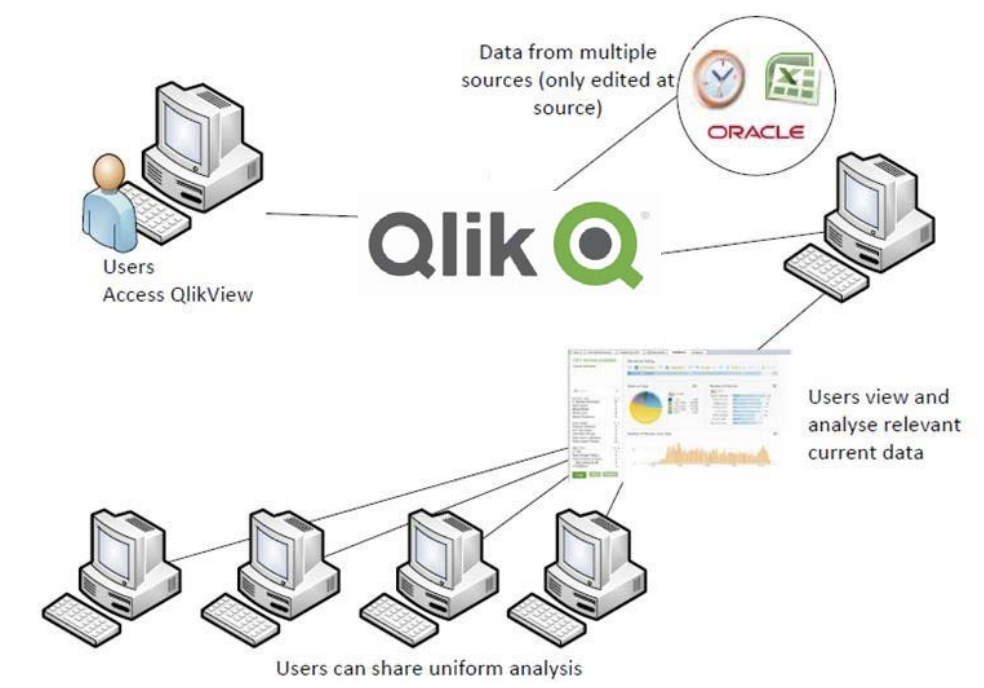
Maja’s vision was to enable better informed decisions by the business at the point of action, through a completely new approach to HR analytics; to find an alternative to spreadsheets that would use engaging and meaningful visualisations, facilitating dynamic and real‐time data discovery driven by the user (Figure 2).
Getting started: finding expertise and experience and building buy-in
The first step on the journey was to generate an appetite for this new approach from the HR Directors and convince them of its achievability.
"I started by approaching the Insights and Data team who work with our clients to build analytics products and solutions. They were very supportive of the idea and instantly connected me with Qlik, one of our partners. After discussing our requirements, Qlik saw the potential and gave me access to a consultant for a couple of days, free of charge, to build a proof of concept."
Maja Luckos,HR Business Partner
Building a proof of concept for the tool was the first major step in moving from ideas to implementation. Three simple applications were built over the course of the two days with the Qlik consultant, focusing on Attrition, Talent and L&D. All were underpinned by the same data feed from Oracle HR, providing a consistent picture throughout. It was important to prepare thoroughly before meeting with the consultant, organising the data and making decisions on the key areas that would instantly grab attention, in addition to the most critical KPIs.
"Talent was definitely key. We’requite good at identifying our talent, using a nine box grid that is well established. We designed one example for talent that was dynamic so you could pick and choose different dimensions, eg grade, and the application would tell you how many of the population were in each position on the grid (Figure 3). This immediately highlighted some inconsistencies in the data, which helped to show how useful the tool could be. You could also understand the succession pipeline; which is something that the HR Leadership team liked."
Maja Luckos, HR Business Partner
The applications were presented to the HR Leadership team and they were instantly sold on the approach. Seeing their own data presented in this new way really captured their imagination and they agreed to invest in further development of the tool. The aim was defined; to build one application covering all key HR areas; Headcount, Talent Management, Attrition, Career & Employability, Recruitment, Sickness & Absence and L&D.
Defining the audience and the users for the tool was also critical during this scoping phase. Whilst the HR team knew that they needed to gain better insights from their people data, there was little understanding of how the tool could be used by other functions. A process of consultation was undertaken to ascertain exactly how the business may use the data, and what format the final tool should take to deliver the best insights.
"There were two intended types of primary user for the tool so we initially rolled it out to the HR teams that would benefit most as they work closely with decision makers in the business, but also eventually wanted to share it with the line managers, team leadersand capability leads, who manage large teams of 50 plus people, so they could use the insights to better inform decisions."
Maja Luckos, HR Business Partner
Figure 2: Management of data through QlikView
Setting up definitions
The model had to be able to compute data from various established systems and data sets which were already well used across HR and other business functions. Integrating these established systems was a significant undertaking which took considerable time:
"We had to include a few different data sets – the biggest one came from our Oracle HR system, which is very comprehensive and holds good quality data. This accounts for around 70% of the data requirement in the application. The rest came from different data owners across other functions – which took a little longer as we needed to get their buy‐in to feed into the process. For example, you have to get your respective Heads of Talent, Recruitment, L&D etc. involved and excited about this as well."
Maja Luckos, HR Business Partner
Then the process of setting up definitions began. Maja and her colleagues had to define the measures that were to be computed in thesystem, according to those who were running the analytics, and those who would be using the outputs. Deciding which elements needed to be measured was also an important consideration, as there are various measures that can be applied, often for thesame concept. Maja recommends focusing on the priority measures, which can be understood more by considering:
"Once we had requirements we had to go through the process ofdefining what each measure was, so what recruitment cost equals, and the formula you would use to calculate it. You end up with a long list which must be prioritised. I think you have to constantly challenge yourself; what is the value in looking at those KPIs? Why should we be measuring this process?"
Maja Luckos, HR Business Partner
Through exploring how the business understands specific HR terms, the team soon realised that there were few set definitions that ran across all functions and HR teams. This meant there was no common language when talking about people measures, either within HR or with colleagues from other functions including finance:
"We found that in some parts of the business the definition for ‘Top Talent’ differed to ours. So although we have a similar 9 box grid, we define two of our boxes as ‘Top Talent’ while they just include the top right‐hand one. So we had to factor these differences in so that anybody could use the tool."
Michelle Steele, HR Business Partner
Building the tool
Once the scope, definitions and data feeds were agreed, the structure of the tool could be put in place. The design of the tool was incredibly important as it had to be easy to use and understand, whilst illustrating data in a clear and coherent way. The application was built section by section by a QlikView Developer, keeping in touch with the main stakeholders throughout. The main focus was on the data model as it was the quality of this that would give users the freedom to draw real insights from the data. Maja and other team members also attended the QlikView Designer training course so they could adapt the tool themselves.
Figure 3: HR dashboard: Talent 9 box grid
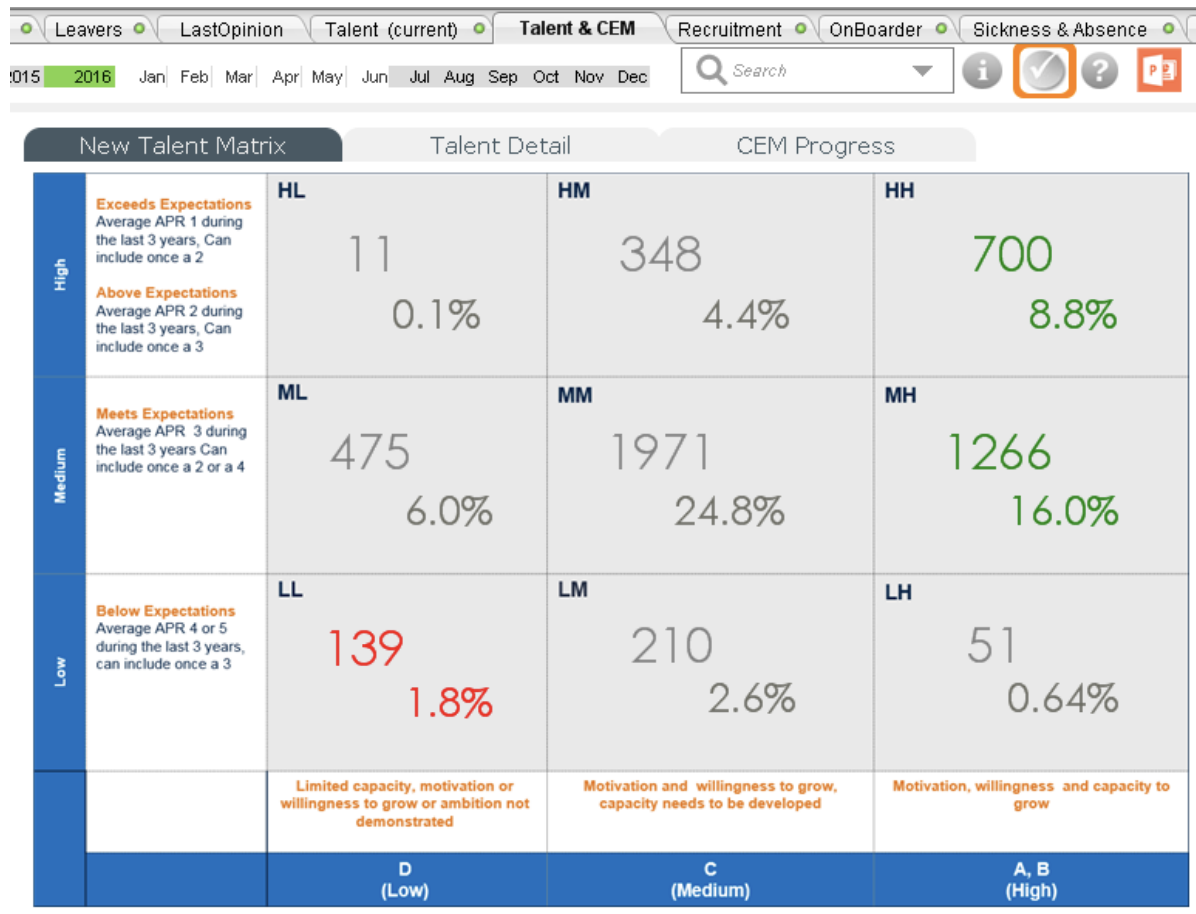
Figures provided for illustrative purposes only.
Figure 4: HR dashboard: Top measures
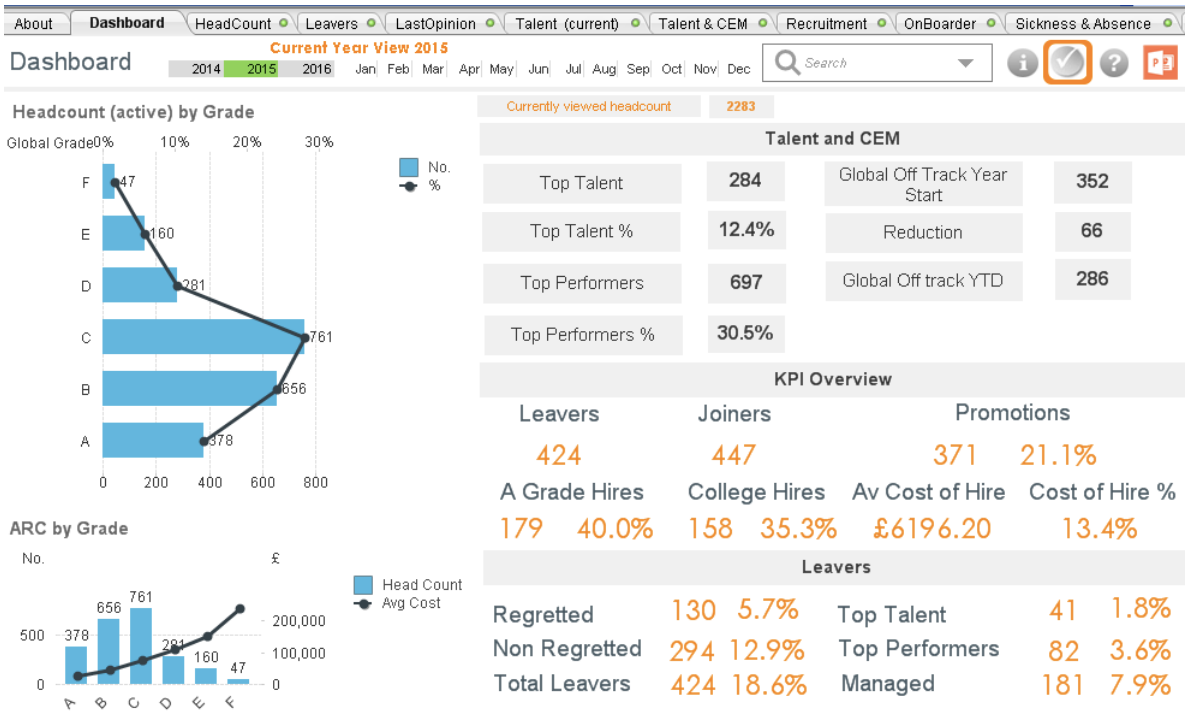
Figures provided for illustrative purposes only.
The application consists of one dashboard which illustrates key performance indicators, and seven areas of interest which Maja defined through a consultation exercise across the business (Figure 4). She looked to the different functions that were already using the data in spreadsheet format to appreciate which particular areas should be considered as key themes in the data model.
"The main area of the tool holds the key performance indicators, and then linked to this are seven analysis areas; Headcount, Talent Management, Leavers, Joiners, Recruitment, Sickness & Absence, and Learning & Development."
Maja Luckos, HR Business Partner
Table 1: Seven analysis areas in the analytics tool:
| Analysis area | Examples of indicative metrics |
| Headcount | • Number of FTEs, flexible and part time labour • Cost of employment: Average Remuneration Cost by grade • Gender split(M/F) |
| Talent | • Population by talent grades (performance and potential) • Percentage of talent against total headcount |
| Leavers | • Regretted and non‐regretted leavers • Managed leavers – cost andsaving • Top talent - Reasons for leaving – using survey data • Leavers by length of service |
| Recruitment | • Cost of recruitment • Average cost of hire • Source of hire • Quality – performance and potential of hires after two years |
| Sickness and absence | • Percentage of days lost to sickness • Cost of short to medium‐term and long‐term sickness • Average days’ sickness per employee |
| Learning and development | • Completion rates • Global hours of training / month & YTD • Classroomand virtualhours • Compliance training |
The tool was given to users to test as soon as it provided enough information for them to draw insights from. The decision to go live partway through development was taken to explore real feedback from users and potential users whilst changes could still be implemented. This allowed the tool to become fit for purpose through real testing, and to highlight any conflicts for different user groups:
"We spent a long time considering how we should build different requirements into the tool, for example, whether we should have different apps for the various user groups or personalise the talent matrix to user needs. In the end we felt that because we could pull all the UK data from most of the feeds, it made sense to have one single application so everyone is looking at the same thing. But it can get complicated when parts of the business have different definitions. In the case of talent management,the long term goal would be that everybody is using the same matrix ‐ I think the application itself might help us get there at some point… by encouraging everybody to work in the same way."
Michelle Steele, HR BusinessPartner
Introducing the HR business to data: using the tool to build capability
The tool was initially launched in one part of the business (covering the data of approximately 4,500 employees). It was then rolled out country‐wide and is today active across HR teams responsible for around 8,000 employees in the UK. There are over eighty users in the HR Community, including HRDs, HR Business Partners, operational HR Managers, recruitment partners, and specific L&D functions. To embed the tool and ensure that it is used appropriately across the business, a programme of training and development was rolled out to users as they explored and used the new system:
"We created some material to help users understand how to use the tool and what the outputs show. It is quite intuitive but you have to understand the data inputs and definitions in detail before discussing it with the business leads. They know their areas best and will therefore always have questions about the data. The future aspiration is to give direct access to the managers themselves."
Maja Luckos, HR Business Partner
Driving value: connecting people analytics to real business issues
Through using the tool, the team has started to explore specific aspects of their workforce which they believe will help the business to perform. One particular aspect is how attrition differs across business functions. The application enables teams to cut attrition data according to function and role, and compare across the business. An objective for the year is to ensure that non‐regretted attrition is managed and regretted attrition remains low.
The impact on the business? The HR team is noticeably more curious about the data that they collect and the performance of some of the core processes of HR. There is now a much greater appetite for the organisation to question the efficacy and impact of certain HR projects and to share the insights with the business, to inform and drive people performance:
"It’s revolutionary for us as an organisation… users kept telling me that what they now get in terms of data analysis is amazing. We had a meeting with someone who’s worked with our organisation in HR for a long time, and different regions across the globe, and she was stunned by the amount of detail in the tool. I think the HR teams now use their curiosity to investigate, analyse, and get to the bottom of the problem. They use the skills they already have as HR professionals but aided by the application."
Maja Luckos, HR Business Partner
Sickness and absence are also areas of real interest to the business. A lot of time was spent considering definitions and understanding how the business would view and use the analytics being provided – particularly because trends are displayed for both short‐term and long‐term sickness, and the associated costs. The tool is opening up new conversations around sickness which are based more firmly on evidence. The real‐time application of data is helping to assess and alter business activities, such as campaigns to reduce sickness absence (Figure 5):
Figure 5: HR Dashboard: Sickness and absence
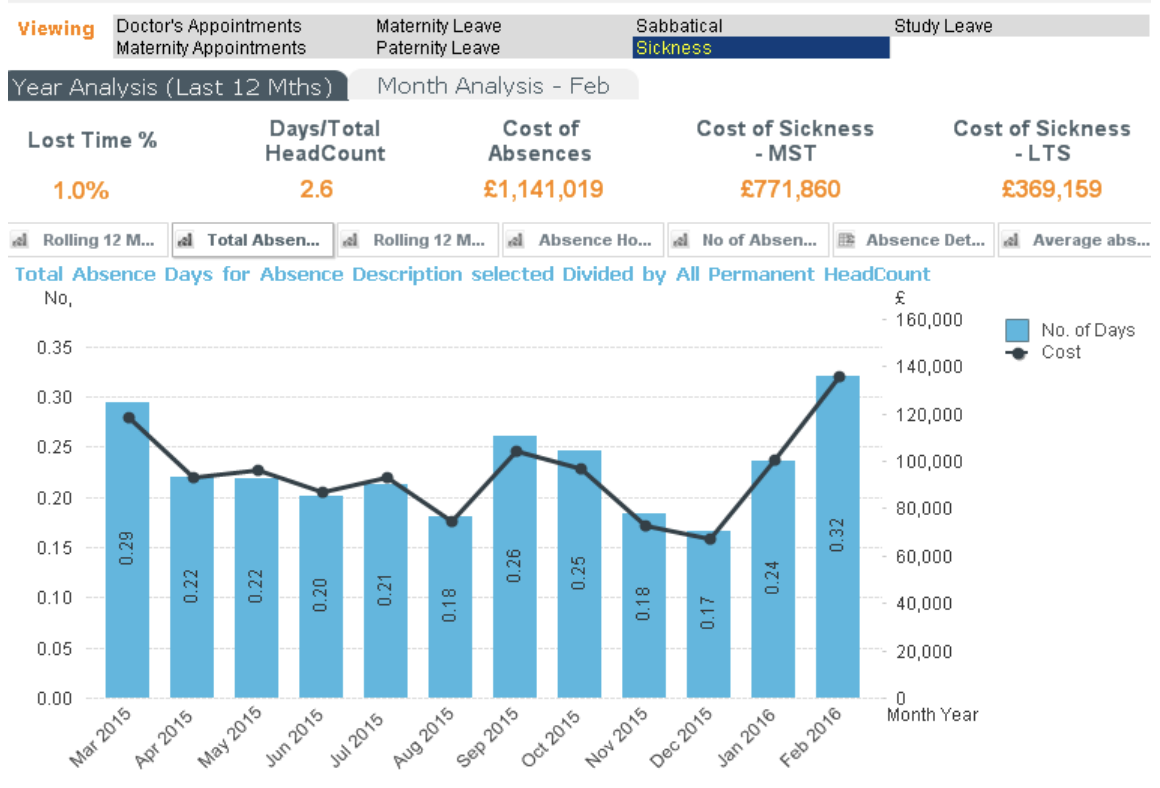
"Sickness has been a much bigger subject than I ever thought it would be. Many users are interested in sickness trends and analysis. It is probably the area that I spent most of my time on because everybody had a different view of what the definitions should be. Once we got it working, the HR teams really valued being able to see at a glance whether their activitiesto tackle sicknesswere making a difference. Before we had the application, it wasn’t as easy to compare month on month via the spreadsheet reports."
Michelle Steele, HR Business Partner
When it comes to saving costs in the organisation, a knowledge‐based company such as Capgemini relies on the significant, and expensive, expertise that its consultant, development and research teams have. For the HR team, few measures have been as useful and fascinating for the business to consider in real‐time than the measures of recruitment, such as cost and rate.
‘The highest impact measure is costof recruitment because once is visible and you can cut it in many ways you can relate it to so many other things.
"I think it is interesting that in my interactions with the business recruitment always attracts a lot of attention. It is easy to compare the measure in many different ways to our profitability and performance as a business. Anything you spend on recruitment fees hits your bottom line, and that’s the message that everybody gets in the business and that is a start of many interesting and more focused conversations for example around retention."
Maja Luckos, HR Business Partner
Turning the HR tool into a commercial product
The aspiration is to take the framework of measures and the indicative definitions and develop a commercial product that customer facing teams at Capgemini can begin to share with clients. The dashboard in particular is something the business is keen to introduce its clients to. Building commercial viability from the beginning has been important for the HR team, who knew that for the business to commit resource to the HR product, there was some requirement to understand its business value. The business believes that the direct value that the tool could generate as a commercial product is high, and also suggests that the business can start to build and learn from sharing the tool externally:
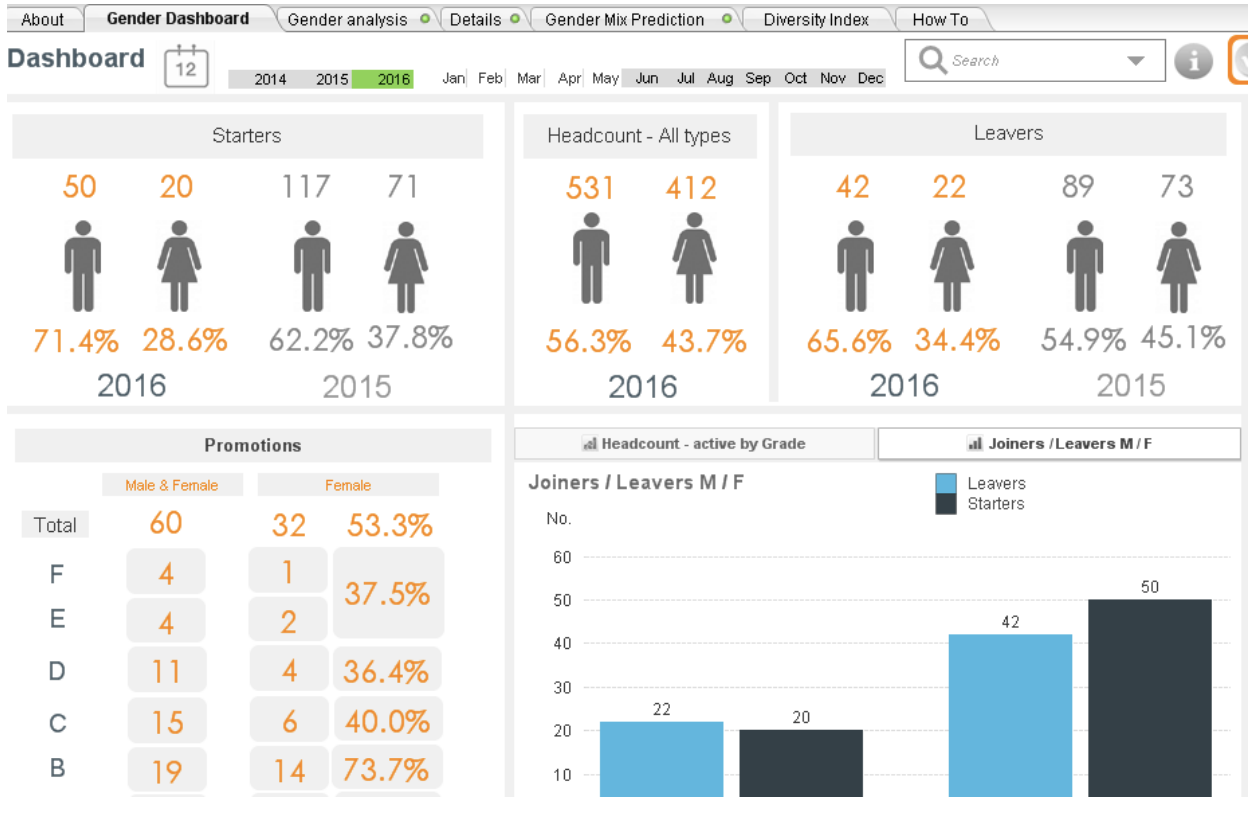
Figure 6: Diversity and inclusion (D&I) dashboard
"We’ve taken the application back to the part of the business that supported it initially and they want to start using it as one of their credentials when developing proposals. So now, when we bid for HR analytics work, we can say that we have intellectual property and expertise that we can share and use with theclient. Obviously every business will be different, so some people will have a slightly different view on how they measure and identify their talent, and what KPIs they want to look at, but as a framework it could potentially work for any company once you understand their specifics."
Maja Luckos, HR Business Partner
Within a year, the HR team have moved from ad‐hoc, disjointed operational reporting ‐ where 56% of companies are according to the Bersin by Deloitte maturity model ‐ to proactive advanced reporting which makes Capgemini one of 30% of organisations. The next step is to join the exclusive 10% through strategic analytics in 2016.1
Now that the tool has gained strong reputational impact across the organisation, there is real appetite to explore how it can be applied to other areas, with an application focused on Diversity & Inclusion already in production (Figure 6). This incorporates a predictive analysis slant which is a very exciting development for the HR team and demonstrates the next step in the HR analytics journey that Capgemini wants to take.
1 Bersin, J. (2012) Big Data in HR: Building a competitive talent analytics function – the four stages of maturity. Bersin by Deloitte. April.

CIPD Trust
Tackling barriers to work today whilst creating inclusive workplaces of tomorrow.
Bullying
and harassment
Discover our practice guidance and recommendations to tackle bullying and harassment in the workplace.

Learn how to measure turnover and retention, and understand why people leave organisations

Creating a holistic offering to help improve workforce wellbeing

