Thanks to sophisticated payroll software, it is relatively easy for organisations to collect and publish the pay data required for gender pay gap reporting. However, what you do with the figures afterwards may require far more skill from people professionals.
Although not compulsory, it’s important to create a narrative, putting the figures into context for your customers, your employees and other stakeholders, and set out the action you plan to take to address the gap. Any gender pay gap is likely to reflect a combination of internal and external factors (on the one hand, say, the extent of managerial discretion in setting starting salaries and, on the other, the availability of childcare provision locally) that you need to explore.
The CIPD provide information on the relevant legislation in our dedicated member resource. The legal information provided is for guidance only and if your organisation is following related legal proceedings, you should seek further legal advice from a specialist solicitor.
For information on what the gender pay gap is, if you need to report on it and why, refer to our guidance on understanding the gender pay gap
Creating your dataset
From 2013 onwards, almost all employers (with very few exceptions) have been required by law to run their payrolls on computer, so that they can transmit up-to-date information to HMRC about who their employees are and what they have paid them. This means that employers affected by the requirement to report on the gender pay gap will already be using payroll software, and you will find that most payroll software gives you sufficient control over your payroll system to be able to quickly record and analyse the information you need.
Good software will help to ensure payroll data is accurate and easy to review, and its reporting capacity should be sufficiently flexible to enable your gender pay gaps, including your bonus gap, to be calculated and reported on.
Some of the data you are being asked to collect can be taken from your existing pay and people records, but some, say the hourly pay of full-time relevant employees, or the amount of bonus pay, may require you to carry out some calculations before inputting the data into your spreadsheet or data structure. As each organisation will differ in the way in which it processes its information, it’s not possible to be definitive about the way in which you will populate your dataset.
The information you pull together on your employees is known as a dataset. A dataset is a collection of discrete items of related data that may be interrogated individually (how many hours does an individual employee work?) or in combination (how many female employees receive a bonus?), or as a whole entity (what is our mean gender pay gap?).
Whether you create your dataset from scratch or import some pay and people data into your structure or spreadsheet from your existing records, before you begin to populate your dataset, it’s essential to ensure the quality of the data.
Inaccurate data produces inaccurate results. At best, calculating your gender pay gap will take a lot longer than it should do and, at worst, you will come up with a figure that either overestimates or underestimates the gender pay gap in your organisation. The most likely sources of inaccurate data are changes in the hours that people work (which would affect the outcome of all your calculations) and changes in bonus payments (which would affect the outcome of your calculation of the bonus gaps).
Data cleansing should be carried out regularly, at least on an annual basis and prior to preparing your gender pay gap report.
You will need to ensure that data from different sources are compatible. If you use different payroll systems for different groups of employees – for example, those paid weekly wages and those paid monthly salaries – to calculate the gender pay gap for the organisation, data will need to be exported from each payroll system into a single spreadsheet.
You will need to record the following data:
- A list of all relevant employees and all full-pay relevant employees. Whether you are caught by the Regulations depends on the number of relevant employees you have on the snapshot date. Find out if your organisation needs to comply with the regulations. Remember that you cannot use full-time equivalents but must base your calculations on the number of individual employees.
- A record of whether each of the relevant and full-pay relevant employees is male or female – you will use the male/female comparison to determine your gender pay gap (see ‘Ask employees to confirm their gender’ below).
- A list of all ordinary pay received in the relevant pay period for full-pay relevant employees only – this information underpins the calculations of the mean and median pay gaps.
- A record of all bonuses received in the relevant bonus period (the preceding 12 months ending on the snapshot date being used for calculations) for all employees (relevant and full-pay relevant). This information underpins the calculation of the bonus pay gap as well as the mean and median pay gaps.
- A record of all bonuses received during the relevant pay period for full-pay relevant employees only – this information underpins the calculation of the bonus pay, mean and median pay gaps.
- A record of the weekly working hours for full-pay relevant employees only – this information underpins the calculation of the hourly rate used in calculating both the mean and median pay gaps.
- A record of the hourly pay for full-pay relevant employees only – this information underpins the calculation of the hourly rate used in calculating both the mean and median pay gaps too.
- Proportion of men and women in each pay quartile (lowest to highest).
You will also need to record compulsory employee deductions, such as court orders requiring child support payments, or other forms of attachment of earnings. This is because employees’ ordinary and bonus pay is calculated before deductions are made at source.
The period over which a bonus is paid may differ from that for ordinary pay and allowances. If the period for which a bonus is received is the same as the relevant pay period, the full amount of the bonus should be recorded. If the period for which the bonus is received differs from, or exceeds, the pay period – for example, the ordinary pay period is a month, but the bonus pay period is a year – you will have to pro-rate the amount of bonus; in other words, you will have to divide the amount of bonus by the number of days in the bonus period, and multiply the result by the number of days in the pay period.
Bonuses are only included in the calculations if they have actually been received within this period. The period to which a bonus is attributed is not relevant for these. For example, a public sector bonus awarded because of good performance in 2020 but received in March 2022 will need to be included in calculations for the relevant bonus period 6 April 2021 to 5 April 2022.
You will have to report a gender bonus gap calculation even if you do not pay bonuses. Your percentage figure will be zero.
Bonuses include anything that relates to profit-sharing, productivity, performance, incentive, or commission. Non-consolidated bonuses are included. They must be received in the form of cash, vouchers, securities, securities options and interests in securities.
Watchpoint: If your organisation pays bonuses in securities, the value of these is included at the time the employee incurs income tax. And so, if an employee decides to defer their entitlement to bonus pay, for example in the case of a long-term incentive plan, you would not include the bonus in your calculation until the amount gives rise to income tax.
Bonus pay does not include pay related to paid overtime, redundancy or termination of employment, or pay in lieu of annual leave.
Long-service awards with a monetary value (cash, vouchers or securities) are also included, but any other type of non-monetary award under this category, such as extra annual leave, should be treated as a benefit in kind and excluded. Gross amounts should be used.
Watchpoint: It may sometimes be difficult to distinguish whether a bonus (or part of a bonus) relates to overtime hours. If this is the case, the element of bonus pay which may relate to overtime should be included in bonus pay.
Used to establish an employee’s ‘hourly pay’. For the purposes of gender pay gap reporting, employees should be treated as having normal weekly working hours if they have the same contractual hours each week, even if they often work additional unpaid hours.
Weekly working hours do not include paid or unpaid overtime, as overtime is excluded from the calculations.
If an employee is paid on the basis of piecework, their weekly working hours will be either the number of hours of work set by the employer, or the number of hours of output work in a week during the relevant pay period.
Weeks where no work has been done
An earlier week must be substituted for weeks where no work has been done (such as a week of sick leave). So, in the previous example, if the employee had taken a week’s unpaid leave for family reasons, you would ignore that week, and either refer back to the week before the six weeks preceding the snapshot date, or forward to the week after the six weeks after the snapshot date.
Weeks where some, but not all, days have been worked (such as a week with three days worked and two days taken as unpaid special leave) must be included.
Employees on call or sleeping in
Hours during which an employee is required to be on call, awake and available for work must be included in their weekly working hours.
Hours during which an employee is sleeping are not included, even if the employee must sleep at or near their place of work. However, if they are woken up to carry out work during the reference period, the waking time must be included in their weekly working hours.
Employees with regular working hours
If an employee (a) has a fixed hourly rate of basic pay (whether they have normal working hours or working hours that differ from week to week or over a longer period), and (b) does not receive any bonuses or any allowances, shift premiums or other variable pay during the relevant pay period, you will already know what their hourly pay is, and you will not need to go through the hourly rate of pay calculation set out in the Regulations.
If an employee is contracted to work the same number of hours every week, their ‘weekly working hours’ will be the number of normal weekly working hours specified in their contract of employment on the snapshot date; this is so even if they leave after the snapshot date, but before the relevant pay period ends. An example would be when, for a public sector employee, their pay period of a month straddles the snapshot date of 31 March, but they leave your employment partway through the working week beginning on 1 April.
Employees with variable working hours
If the employee is not contracted to work the same number of hours every week, their ‘weekly working hours’ will be the average number of hours worked (excluding any hours worked as paid or unpaid overtime) over the pay period that straddles the snapshot date.
The average number of hours worked can be found by dividing the total number of hours worked over the 12 weeks that end with the last complete week of the relevant pay period. So, for example, if a pay period of a month ends on Friday, 7 June, and the employee has worked 37 hours for 6 of the 12 weeks (222 hours) and 30 hours for the other 6 (180 hours), the average number of hours worked is 402 divided by 12 = 33.5.
If an employee on a variable hours contract changes their contract during the 12-week reference period, so as, say, to increase the number of hours worked, you will still divide the total number of hours worked over the 12 weeks by 12.
If you have an employee on variable working hours, but they have not been employed for 12 weeks by the end of the relevant pay period, or there is some other reason the calculation cannot reasonably be made, you must use a number that fairly represents the number of working hours worked in a week. This can be done using the average number of hours you would expect the employee to work in a week, or using the average number of hours of other similar employees.
You may have difficulty obtaining the information needed to determine the hourly pay of someone contracted to do work for you on a personal basis as a full-pay relevant employee. It can, for example, be difficult to quantify the hours worked by a consultant retained for their specialist expertise on a particular project, because what you’re paying for is not the hours they put in, but their expertise.
You can ask for the information, but if you can’t get it, the person should still be included as a relevant employee in your headcount, but it will not be possible to include them as a relevant full-pay employee for the purpose of calculating the gender pay gap. Acas recommends that new contracts should seek, where possible, to ensure that those employed under a contract to do work personally are required to provide the information needed for compliance with the Regulations.
Benefits in kind – non-cash benefits such as company cars, private medical insurance or interest-free loans – are excluded from the calculations.
How is salary sacrifice treated?
A salary-sacrifice scheme is an agreement between an employer and employee to change the terms and conditions of employment to reduce the employee’s entitlement to cash remuneration in return for some form of benefit – say, a pension contribution – that is not reflected in their salary or wages.
The value of salary sacrifice is excluded from the calculations, meaning that you should use the employee’s gross pay after any reduction for salary sacrifice, even if the employee has voluntarily opted into the scheme.
Although not required by the Regulations, we recommend that you also record employees’ names and/or assign a number to each employee. Doing so will enable you to check out any anomalies or apparent oddities.
Although also not required by the Regulations, we recommend that you record employees’ contract status. Recording contract status helps you to decide who to include in the calculation of your gender pay gap (salaried partners, for example) and it will also help you make year-on-year comparisons, as you will be able to see the impact of any changes in the contractual status of a group of workers – say, for example, if your organisation decided to give permanent contracts to a team of people previously retained on a consultancy basis.
Example: The benefits of recording employee status
Gecko Solutions is a three-year-old high-tech company producing specialist software for back-of-house archaeologists. Gecko offers cutting-edge products, and associated training, which are in high demand.
In 2017 Gecko has 253 employees, of whom:
- Three are apprentices.
- 24 are casuals brought in to support product launches.
- 209 are full-time employees.
- 17 are consultants – of these, 12 are supporting the development of the company’s core products, and five are spread across three different projects.
By 2019 Gecko’s headcount has risen to 292:
- 10 employees have left the company.
- 25 additional permanent staff have been recruited.
- The 2017 apprentices are now employed by the company.
- Five more apprentices have been taken on.
- The people previously working as consultants on core products have been taken onto the payroll.
- The number of consultants working on specific projects has risen to 12.
- Gecko no longer employs casual staff.
By recording employee status, Gecko ensures that its headcount is accurate and is in a good position to spot potential problems, such as distortions to the pay system when consultants are taken onto the payroll.
The gender pay gap regulations require you to examine pay by gender, but workplace demographics vary significantly across employers. For some organisations, a full understanding of the gender pay gap will only be obtained by factoring in characteristics such as age and ethnicity. Everyone has multiple identities; some identities have typically afforded people advantages at work and some have been typically associated with disadvantages in the workplace. For example, in recent years we have seen notable progress on female representation at senior levels in FTSE companies, but this progress has mainly been enjoyed by white women.
The gender pay gap increases with age and is deeper for some black and minority ethnic groups. If you think age or ethnicity may be a factor in your workplace, it may be helpful to collect and record information on the age and ethnicity of your relevant employees. You may also choose to cover this in your narrative. This more detailed insight into the causes of your gap will enable you to take more targeted action to address it.
Example: Age as a way of exploring the reasons for a gender pay gap
Hamster Pet Foods is located on the edge of a large housing estate and near to a popular primary school. It is the employer of choice for women with young children and, increasingly, grandmothers providing childcare for their families. Hamster’s mean gender pay gap is 29%.
Hamster’s payment system is responsive to educational and vocational qualifications, and the achievement of in-house progression. Hamster knows that a high proportion of its staff work part-time, but working part-time does not seem to fully explain the extent of the pay gap.
Hamster runs an age check and finds that the gender pay gap for women over the age of 45 is 46%. An analysis of educational and vocational qualifications shows that these older women are not as well qualified as their younger peers. Hamster realises these women have been missing out on in-house development opportunities and initiates a skills audit, with a view to improving the uptake of in-house training and other relevant career development opportunities.
The Regulations ask you to measure your gender pay gap in several ways. The metrics selected are broadly comparable with those used by the Office for National Statistics (ONS). The ONS uses data from the Annual Survey of Hours and Earnings (ASHE) to calculate the gender pay gap for the whole economy. ASHE is based on a 1% sample of employee jobs, drawn from HMRC PAYE records. However, your calculations will be produced, not based on a sample, but on a complete population – that of all the full-pay relevant employees in your workforce. In addition, the ASHE survey covers workers in all organisations, irrespective of their size, while gender pay gap reporting focuses on just large employers with more than 250 staff.
As the sampling techniques used in ASHE are robust, it’s possible to make sensible comparisons between the ONS headline gender pay gap and the gender pay gap figures from your business or organisation. But such comparisons are broad-brush, so don’t worry too much if your organisation’s figures differ from those produced by the ONS. Whatever your gender pay gap, you will want to examine the reasons for it. And, if your gender pay gap is substantially larger, say 28%, as compared with an ONS figure of 9%, it would be a good idea to ask yourself why that is so, and put what is happening in your specific context into the account you give of your gender pay gap.
Hourly earnings
Similarly to the ONS, you are being asked to estimate the gender pay gap based on hourly earnings. By excluding overtime, you can consider the gender pay gap across your workforce as a whole, and not have to go into the detail of comparing the pay of people with differing working patterns – as you would have to do if you were carrying out an equal pay audit.
Bonus payments
Here the comparability between the ONS and gender pay gap reporting is less clear. Estimates are available for both total pay (which includes bonuses) and for regular pay (which excludes bonus payments). The ONS also produces an annual commentary on bonuses, but this does not currently include an analysis by gender. This doesn’t mean you should pay any less attention to the calculations of your organisation’s gender bonus gap – inequalities in the distribution of bonus payments can make a big contribution to the overall gender pay gap, and they also pose a risk of unequal pay.
Example: Comparison with the gender pay gap as measured by the ONS
Ermine is a small financial services company operating across the UK, offering investment advice to mainly older clients. Ermine employs 267 employees: 44% female, 56% male.
Ermine’s median gender pay gap is 25.3%, as compared with the national figure of 9.4%. This is an improvement on the previous year, when the figure was 27.8%. Sixty per cent of females are in the lowest two quartiles. (For further information on quartiles, see 'The proportions of male and female employees according to quartile pay bands' in the section below.)
Fifty-seven per cent of the lowest quartile and 47% of the lower-middle quartile are female. In the highest-paid quartile, 10% are female. The quartile figures show that the main reason for the gap is the lower proportion of women in senior roles relative to men.
In its narrative, Ermine sets its figures in the wider context of education and employment in the UK and points out that for most roles it recruits for, the pool of suitably qualified graduates is predominantly male. Ermine also says what it is doing to help its most talented women to progress to senior roles within the company.
The mean, median and range
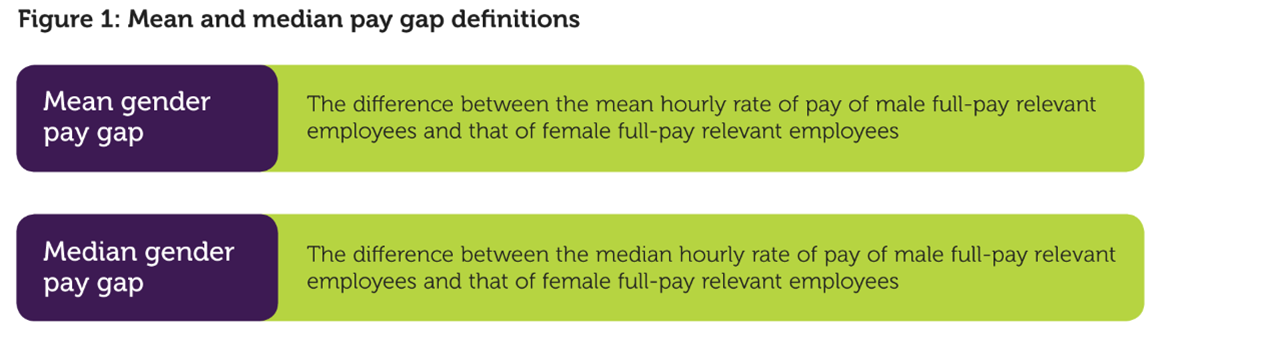
Both the mean and the median are single values that describe the middle or average value of a range of values. The ONS’s preferred measure of the gender pay gap is the median, but you are being asked to calculate the mean as well as the median.
The mean
The mean is the average of all the numbers in a dataset, that is, you add up all the numbers and then divide the result by how many numbers you are dealing with. So, to find the mean hourly rate for your organisation’s full-pay relevant male employees, you would add all their hourly rates together and then divide the total by the number of full-pay relevant male employees.
The median
The median is the numerical value which splits the top 50% of the population from the bottom 50%. To find the median, list all the values – your calculations of total hourly pay for all employees – in numerical order; if there is an odd number of values, the median is the number in the middle; if there is an even number of values, the median is the mean of the two central numbers. So, if you have, for example, 357 employees (either male or female), the median pay would be the pay of the 129th person in a list of all 357 employees in order of their pay from highest to lowest. If you have 358 employees, the median pay would be the mean of the 128th and 129th employees.
The range
The mean and the median need to be read in the context of the range, which is the difference between the highest and the lowest value in the dataset – that is, the highest and lowest hourly pay. In the context of gender pay gap reporting, the range is your pay range. The range tells you how well the mean or the median represents the data. The Regulations do not require you to report on your pay range, but the range is an inherent part of your preliminary calculations.
Proportions
A proportion is a number that is read in comparison with other numbers. It can be expressed as a numerical value (25 out of 100 women received a bonus payment); a fraction (a quarter of the women we employ received a bonus payment); or a percentage (25% of the women we employ received a bonus payment). The Regulations ask you to express proportions as a percentage, but it is worthwhile remembering that in some circumstances a numerical value may be a more effective way of communicating what you have to say.
Quartiles
A quartile is one of three points that divide a population into four equal parts. In the context of gender pay gap reporting, the four quartile pay bands are created by dividing the total number of full-pay relevant employees (that is, not the pay bands) into four equal parts. The intention is not to divide the pay range into four equal parts, but to ensure equal numbers of employees in each quartile. If you are already using quartile measures based upon your existing pay bands to provide you with information about your pay data, you will not be able to use these for the purposes of gender pay gap reporting.
Who are your relevant and full-pay relevant employees?
Relevant employees are all employees employed by you on the snapshot date of any given year.
The definition of ‘employee’ is the same as that in the Equality Act 2010. This is known as an ‘extended’ definition because it includes: employees (that is, those with a contract of employment); workers and agency workers (that is, those with a contract to do work or provide services); apprentices; and some self-employed people, where they personally perform the work. This includes employees on full pay, and employees on less than full pay because of leave, irrespective of how short a time they have been working for you.
The Regulations require you to report on the number of individual employees, and not on full-time equivalents. This means that if two people share a job, they are counted as two employees.
Your list of full-pay employees is the basis of your gender pay gap calculations. It is drawn from the list of relevant employees that determines your headcount.
A full-pay relevant employee is one employed and receiving full pay (or pay for piecework) during the specified pay period.
An employee taking parental leave or sick leave on full pay would be included, but employees on reduced pay, for a reason such as maternity leave or any other form of long-term special leave, do not count as full-pay relevant employees, even though you have counted them towards your total of relevant employees. If an employee is on unauthorised absence or on strike, they count as a full-pay relevant employee.
Employees who receive no pay at all during the relevant pay period, for example because they are on unpaid leave, should be excluded from the gender pay gap calculations.
Example: Relevant and full-pay employees
Impala have 853 employees across three sites. On the snapshot date some employees are on strike. Impala's count of full-pay relevant employees is 844.
| Employee attendance | Number | Relevant employee | Full-pay relevant employee |
| At work | 811 | Yes | Yes |
| On paid annual leave | 5 | Yes | Yes |
| On full-pay sick leave | 3 | Yes | Yes |
| On reduced-pay sick leave | 2 | Yes | No |
| On full-pay maternity leave | 5 | Yes | Yes |
| On reduced-pay maternity leave | 3 | Yes | No |
| On full-pay paternity leave | 4 | Yes | Yes |
| On full-pay parental or adoption leave | 1 | Yes | Yes |
| On unpaid carers' leave | 3 | Yes | No |
| Unexplained absence | 1 | Yes | Yes |
| On strike | 15 | Yes | Yes |
| Totals | 853 | 853 | 844 |
How to calculate hourly pay
Calculating hourly pay
For the purposes of gender pay gap reporting, the amount of an employee’s ordinary and bonus pay is calculated before deductions are made at source. Deductions include both employer deductions – PAYE, National Insurance and pension contributions – and compulsory employee cash deductions. If an employee uses some or all of their bonus payment to make a contribution to their pension, this too will be treated as a deduction, and the bonus payment amount before the pension contribution would be used.
However, where an employee contributes to a pension either by means of a salary or bonus sacrifice scheme, the employee’s gross salary after the reduction should be used.
The pay period
The pay periods inform the calculations of ordinary and bonus pay. The pay period is the period in which the relevant employer pays the relevant employee basic pay – typically a week, a fortnight or a month. You must make sure the pay period is the same for all relevant pay employees (or take account of differences in calculations). If employees are paid in an irregular manner (for example, you pay them an irregular amount every month), it may be prudent to designate up to a year as the pay period.
If an employee does not receive basic pay but does receive some other form (or forms) of ordinary pay (say, for piecework), the pay period is the period in which you most frequently pay that form of ordinary pay. For example, if the employee receives pay for piecework only, and you pay them for the number of pieces created in a week, the pay period is a week.
The period over which a bonus is paid may differ from that for ordinary pay and allowances.
The relevant pay period
The relevant pay period is the pay period within which the snapshot date falls, that is, the pay period in which 31 March (for public sector employers) or 5 April (for all other employers) falls.
Any ordinary pay received in the relevant pay period that would normally be received in a different pay period (such as a payment to remedy an accidental underpayment in the previous period) should be excluded from your calculation of hourly pay. Similarly, if an employee receives any backdated pay in the relevant pay period, only the amount attributable to the relevant pay period should be included in your calculation of ordinary pay
Ordinary pay
You will use ordinary pay, expressed as hourly pay, to calculate your organisation’s mean and median gender pay gaps.
Be mindful to distinguish between an allowance and a payment for expenses, or an allowance and a bonus payment, or an allowance and a benefit in kind.
If you are in any doubt, you should seek professional advice.
Example: A reminder of what counts as ordinary pay
Jackal Travel has 12,334 employees. Jackal's pay system includes shift pay, overtime, cars and car allowances, free uniforms, a London allowance, allowances for living abroad on six-month placements, allowances for staff working in the smallest offices, and additional allowances for duties such as oversight of health and safety.
| Payment/allowance | Counted as ordinary pay? |
| Basic pay | Yes |
| Overtime pay | No |
| Shift payment for weekend working | Yes |
| London allowance | Yes |
| Allowance for living abroad | Yes |
| Meal allowance when working abroad | No |
| Travel expenses for travel within GB | No |
| Free uniforms | No |
| Health and safety allowance | Yes |
| Season ticket loan | No |
| Company car | No |
| Car allowance | Yes |
Calculating ordinary pay
You will use hourly pay as the basis for calculating mean and median pay gaps, but before you can do so, you will need to calculate the hourly pay itself.
Hourly pay can be calculated on the basis of an annual salary, a monthly salary or variable hours
Calculating hourly pay based on annual salary
For each full-pay relevant employee:
- Total the annual salary (basic pay, any allowances and any bonus payments).
- Divide the total annual amount by 365.25; this gives you the daily salary.
- Divide the daily salary by the number of hours worked in a day; this gives you the hourly rate.
For example, see calculation 1 in the calcuation examples download at the bottom of the page.
Calculating hourly pay based on monthly salary
For each full-pay relevant employee:
- Total the monthly salary (basic pay, any allowances and any bonus payments).
- Divide the total monthly amount by 30.44 days; this gives you the daily salary.
- Divide the daily salary by the number of hours worked in a day; this gives you the hourly rate.
Calculating hourly pay based on variable hours
For each full-pay relevant employee:
- Work out how many hours the employee worked over the 12-week reference period (see regulations law page).
- Total the amount of basic pay plus any allowances and any bonus payments received in the relevant 12-week pay period.
- Divide the total amount of pay by the total number of hours worked over the 12-week period.
For example, see calculation 2 in the calcuation examples download at the bottom of the page.
Calculating bonus pay
You need to include bonuses received by full-pay relevant employees in the calculation of hourly pay for the relevant pay period.
You will also need to use information about bonus pay to calculate your organisation’s mean and median bonus gaps, and to determine the proportions of men and women receiving bonus pay.
For each full-pay relevant employee:
- Total the amount of bonus pay received over the relevant 12-month period.
- Divide the total annual amount by 365.25; this gives you the amount of bonus averaged over each day.
- Divide the daily amount of bonus pay by the number of hours worked in a day; this gives you the hourly rate of bonus pay.
For example, see calculation 3 in the calcuation examples download at the bottom of the page.
The measures
Mean gender pay gap
To calculate the mean gender pay gap, you will first have to calculate the mean hourly rates of ordinary pay for both male and female full-pay relevant employees.
- Add up the hourly rates of pay for all male full-pay relevant employees.
- Divide the total by the number of male full-pay relevant employees (A in the equation below).
- Add up the hourly rates of pay for all female full-pay relevant employees.
- Divide by the total number of female full-pay relevant employees (B in the equation below).
The Regulations state that the mean gender pay gap must be expressed as a percentage of the mean hourly rate of pay of male full-pay relevant employees, so your calculation is as follows:
A-B |
x |
100 |
A |
For example, see calculation 4 in the calcuation examples download at the bottom of the page.
Median gender pay gap
The median is the numerical value which splits the top 50% of the population from the bottom 50%. To find the median, list all of your calculations of total hourly pay for all employees in numerical order, from the lowest hourly pay to the highest: if there is an odd number of values, the median is the number in the middle; if there is an even number of values, the median is the mean of the two central numbers.
To calculate this, you will first have to calculate the median hourly rate of ordinary pay for both male and female full-pay relevant employees.
To do this:
- List the hourly rates of pay for all male full-pay relevant employees and find the midpoint (A in the equation below).
- List the hourly rates of pay for all female full-pay relevant employees and find the midpoint (B in the equation below).
The Regulations state that the calculation of the median gender pay gap must be expressed as a percentage of the median pay of male full-pay relevant employees, so your calculation is as follows:
A-B |
x |
100 |
A |
For example, see calculation 5 in the calcuation examples download at the bottom of the page.
The median gives you an indication of what the ‘typical’ situation is, but, if your organisation has a complex pay system, there may not be a typical situation. By failing to take account, for example, of the impact on the gender pay gap of a small group of very highly paid employees, a median can give you a ‘false positive’, meaning that you don’t take the action necessary to close the gap.
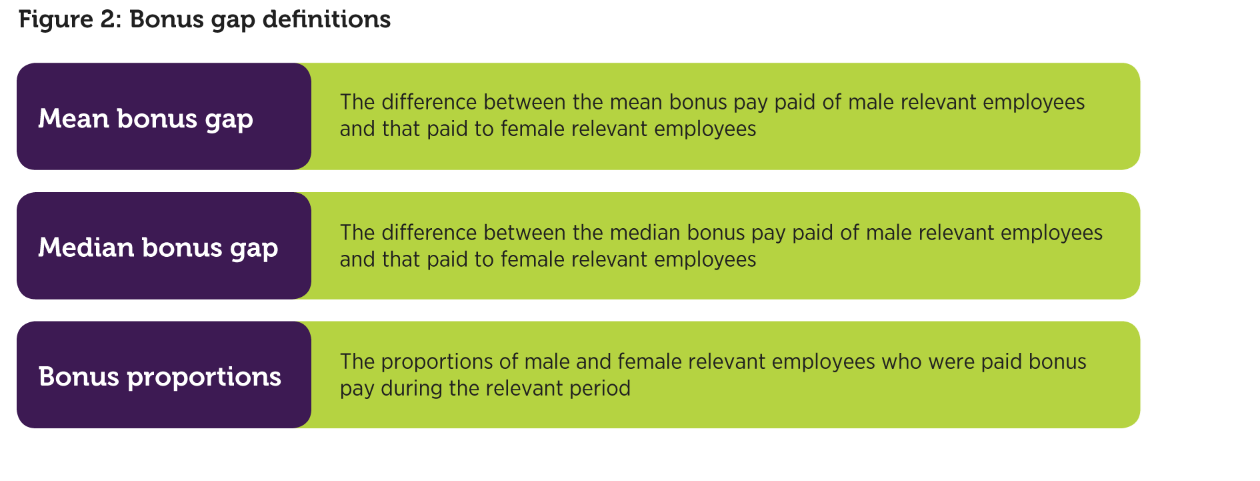
Mean bonus pay gap
To calculate this:
- Add up the bonus pay for all male full-pay relevant employees.
- Divide the total by the number of male full-pay relevant employees (A in the equation below).
- Add up the bonus pay for all female full-pay relevant employees.
- Divide by the total number of female full-pay relevant employees (B in the equation below).
The Regulations state that the mean bonus pay gap must be expressed as a percentage of the mean bonus pay of male full-pay relevant employees, so your calculation is as follows:
A-B |
x |
100 |
A |
Median bonus gap
To calculate this:
- List the bonus pay for all male full-pay relevant employees and find the midpoint (A in the equation below).
- List the bonus pay for all female full-pay relevant employees and find the midpoint (B in the equation below).
The Regulations state that the calculation of the difference between the median bonus pay gap must be expressed as a percentage of the median bonus pay of male full-pay relevant employees, so your calculation is as follows:
A-B |
x |
100 |
A |
Bonus proportions
The bonus proportions are the proportions of male and female relevant employees who were paid bonus pay during the relevant period. Both must be expressed as percentages.
The first part of the calculation is as follows:
A-B |
x |
100 |
A |
In this equation A is the number of male relevant employees who were paid bonus pay during the 12-month period ending with the snapshot date; and B is the number of male relevant employees.
The second part of the calculation is as follows:
C |
x |
100 |
D |
In this equation C is the number of female relevant employees who were paid bonus pay during the 12-month period ending with the snapshot date; and D is the number of female relevant employees.
For example, see calculation 6 in the calcuation examples download at the bottom of the page.
How to communicate your gender pay gap
Gender pay gap reporting isn’t just about the figures you come up with; it’s also about the story that those figures tell. It’s your story. It’s up to you to tell it effectively. The bare bones of any communications plan are the reporting requirements themselves, so let’s recap on how these work.
The government websites
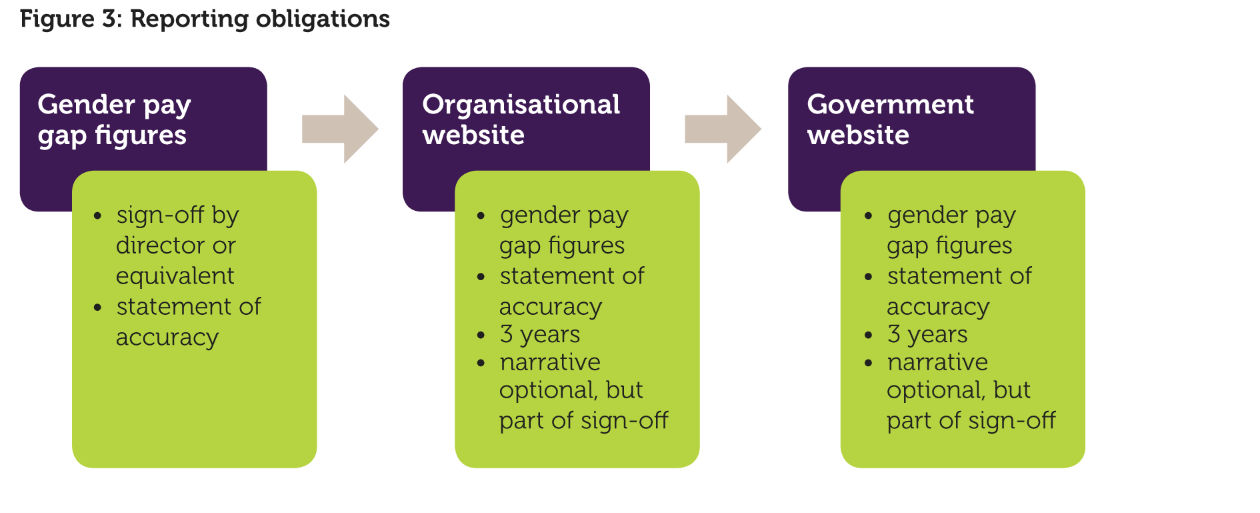
As we saw in the summary, you must publish the required data on the government’s gender pay gap reporting service website. If you choose to include a narrative and action plan, the reporting site lets you do so by providing a link back to where your gender pay gap report appears on your own website.
Once you have published your report on the reporting service website, it automatically appears on the government’s viewing service website, where any interested person is able to access both your figures and anything else you may have said about your report.
The viewing service website also lets people know if a report is late, so filing a late report, for whatever reason, is a public act and, as well as laying your organisation open to the possibility of enforcement action by the EHRC, you may also be asked questions about why your report has not yet been published.
Your own website
You must also publish your pay data on your own organisation’s website in a manner that is accessible to employees and the public, and you will have to ensure that it remains there for at least three years. In the first few years of reporting, several organisations have either overlooked the requirement to publish their gender pay gap report on their own website, or have published it, but in a way that makes it difficult to find. As a rule of thumb, it should take no more than three clicks to locate your gender pay gap report.
For private and voluntary sector employers, the gender pay gap figures must be accompanied by a statement confirming the report’s accuracy, signed by a director or equivalent, which includes their name and job title. While the Regulations say that sign-off should be by a director or equivalent, you have some choice over who this might be. It could be, for example, the finance or HR director, or whoever at director level is leading on equalities.
In deciding who to choose, their role or status is not the only consideration. The person whose name appears may well be the person contacted with any official queries, say from the EHRC. And if you also intend that the person doing the signing off should act as the organisation’s spokesperson on gender pay gap reporting more generally, you will want to be sure that whoever takes on this role is a good communicator who thoroughly understands gender pay gap issues, both generally and within the organisation.
If you choose to include a narrative, this must be included in the sign-off process; in other words, whoever signs off the calculations will also vouch for the accuracy of the narrative.
While the quantitative measures in gender pay gap reporting help to reveal the scale of the male/female earnings differential, they do little to explain the context and causes. Nor do they indicate any actions you have already been taking or are planning with a view to closing these gaps. The figures also only indicate the current situation, rather than what you intend to do in the future. This is where a narrative comes in.
The purpose of a narrative is to:
- Describe the relevant organisational context, both internally and externally.
- Explain the calculations.
- Explain as far as possible the causes of any gender pay gaps shown by the data.
- Explain what actions have been taken or are planned to address pay gaps; you can also draw a comparison with previous years’ figures.
- Describe how employees and employee representatives are being involved in this process.
The UK Government expects most employers to include a narrative description alongside the quantitative measures, and this guide also encourages you to do so.
Example of a narrative report
Oxpecker Logistics operates a UK-wide delivery network and has several thousand employees. Its track record on equality initiatives is good, and these are embedded within the company’s HR and operational processes. Oxpecker decides to publish its gender pay gap figures in its annual report, in the section on reward:
“In determining reward for our staff, we balance a number of factors, including the general economic climate, company performance, and the external market for the types of roles that we offer. Our reward system aims to recognise the work that our people put in, and performance over and above the required standard is recognised through our company-wide bonus system, with individual bonuses being determined at a departmental level. Bonus allocations are monitored to ensure objectivity and to keep the total allocation within budget.
In addition, we review pay and bonuses by gender, ethnicity and disability, and use the findings from these reviews to set key performance indicators aimed at narrowing any pay gaps.
This is the first time we have published our gender pay gap. Our median (or midpoint) gender pay gap is 8.1%; our mean gap (the differences between the average earnings of males and females) is 6.4%. Our mean bonus gap is 17%, and our median bonus gap 12.5%. Twenty per cent of our female employees receive bonus payments, compared with 45% of our men. This difference is largely due to the differing roles taken up by men and women within the company.
In addition to reporting on our staff by pay quartiles, we also profile our workforce by grade, and this more detailed analysis allows us to target the underrepresentation of women and ethnic minorities in the upper-middle and upper quartiles.
We continue to take actions to address any gaps and also to take action through wider policies and activities to make sure our policies and practices are fair.”
You will find it useful to produce a written document – it need only be a single sheet of paper – outlining your communications plan. This will prepare you both to deal with any queries, and to use the plan to inform and ensure consistency in your dealings with stakeholders. It should include:
- Your aims.
- Your key messages.
- Your key audiences.
- Your key channels of communication.
- The sequencing of your communications – you don’t, for example, want the media reading your report before your employees do.
- The key risks, such as very few women having received bonus payments, or the potential for equal pay claims – your risks do not have to be made public, but you need to know what they are.
You will also need to agree an approval process for the plan itself, responsibilities and resources.
As well as informing how you promote your gender pay gap report to the public, your communications plan will help you to anticipate employee concerns – will they, for example, understand the difference between unequal pay and the gender pay gap, why the mean and median pay gaps differ, or what the quartile pay bands represent?
In drawing up your communications plan, you may also want to consider the best way to present your pay gap data. Do you want to present your data in pounds and pence, as well as in percentages? Do you want to use visuals? These can be particularly helpful in terms of presenting the median pay gap, and the information on quartiles. People often find pounds and pence more helpful, while others respond well to illustrations.
Your communications plan will not only help you to plan ahead, but it will also provide you with a process that enables you to learn for the future.
Example: A communications plan
Narwhal Financial Services employs over 50,000 employees around the world. It is headquartered in the City of London and has well over 7,000 employees in the UK. Narwhal knows that it has a severe gender imbalance and expects its gender pay gap calculations to reveal substantial gaps between the average earnings of men and women. Narwhal has already had to deal with a couple of individual equal pay claims and is concerned that reporting on its gender pay gap figures may encourage further claimants to come forward.
Narwhal supports a small range of gender equality initiatives, but at middle management level.
Narwhal realises that it needs a communications plan, but that for this to be effective, it also needs an action plan to begin to deal with gender inequalities. It assigns a board member to take the lead on promoting gender equality and asks that person to sign off the company’s gender pay gap reports. The company assigns an experienced member of the HR team to begin to address gender pay gap issues and asks the head of communications to be responsible for delivering the communications plan in this and subsequent years. The two are asked to work together to develop a narrative to accompany the gender pay gap figures.
Narwhal’s communications plan identifies its key audiences as being present and future employees and clients, and its key risks as the possibility of equal pay claims. Narwhal plans to brief employees: first, on the process of gender pay gap reporting – explaining what measures the company is being asked to produce, and then on the actual calculations and the actions it plans to take. The company’s key message is: ‘can do better and this is how’. Knowing that the financial services sector is in the spotlight about gender pay gaps, Narwhal plans to issue a pre-emptive press release, supported by a question-and-answer briefing.
Aims
It is helpful to get your aims agreed at the highest level. At its simplest, your aim is to set your gender pay gap figures in context and to enable you to answer any questions that come up.
You might also want to persuade audiences of your commitment to closing the gender pay gap and to tell them about what you are doing to achieve this. You will almost certainly want to explain any figures that appear to put you in a bad light, but for which there is a straightforward explanation, such as the average cash value of bonuses being awarded to women being lower than those awarded to men because of the distribution of part-time work among your employees. But do focus on the gender pay gap – other equality initiatives may be valuable, but this is not the place to go into any detail about them.
Key messages
Your key messages may include:
- Your organisation’s mission and purpose.
- Where reward sits in your people strategy and what your reward structure looks like.
- Why you are reporting on your gender pay gap.
- Your gender pay gap calculations.
- Your assessment of these, and how this year’s figures look alongside last year’s.
- Past actions to tackle the gender pay gap and/or promote gender equality and the impact those actions have had.
- What you intend to do considering this year’s figures, in other words, your action plan.
For most organisations, these messages can be captured in 500–750 words.
You may also want to comment on the nature of the resources being directed to close the gender pay gap and the timescales over which you anticipate the gap being closed, particularly if that gap has been found to be significant and potentially expensive to address over the short term.
Finally, you might also include in your narrative a description of how you have involved your employees in highlighting and taking actions to combat gender pay gaps. Trade unions are often knowledgeable and supportive and can lend significant weight to any actions taken to address gender pay gaps, while widespread employee communications and involvement helps to build trust that you are working towards improved and fairer rewards.
Remember, the narrative is solely about how you are addressing the core issues involved in closing the gender pay gap. Wider diversity plans are not necessarily relevant and are not required by the Regulations.
Key audiences
Your key audiences may include:
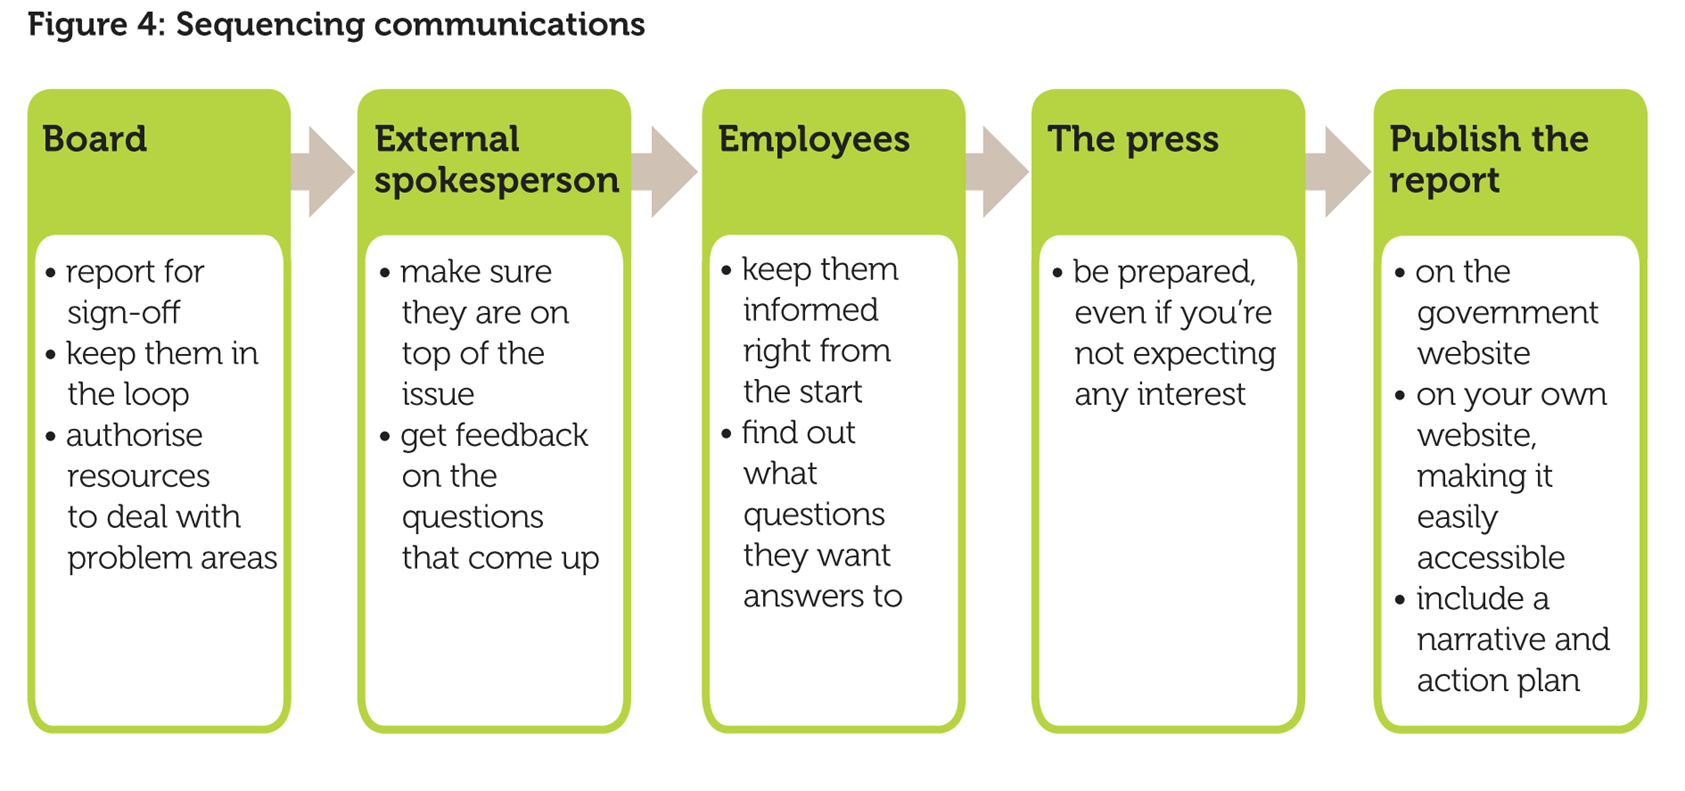
- Your board/shareholders/senior management team – your senior people need to be briefed well in advance and kept in the loop, not least because they control the resources you need to tackle the gender pay gap. And it goes without saying that closing the gender pay gap needs to be championed from the top.
- Your investors – those who invest in your company will want to know how their money is being used to ensure that the company is intent on bringing in and retaining the best people.
- Your employees – the gender pay gap reporting regulations are intended to empower your employees to engage with you over the gender pay gap, and this means that your employees are your most important audience. To maximise the potential benefits of employee engagement, involve your employees at an early stage.
- Your trade unions – if your workplace is unionised, your unions are going to want to engage with you over gender pay gap reporting, and they may want to move the focus towards equal pay. If this is the case, you may wish to identify this as a risk that needs to be addressed.
- Prospective employees – people thinking of coming to work for you are quite likely to check out your own and the government website for information about your gender pay gap and what you are doing about it.
- Your customers – curious customers will be able to access the government website and may judge your organisation based on your gender pay gap report.
- Your competitors – your competitors will look you up, whether you want them to or not.
- The press – the government website will provide the press, both nationally and locally, with a ready source of news. If you are a household name company, or a well-known local organisation, the chances are that you will be contacted by the press.
For each of these audiences, what – in addition to your gender pay gap figures – do you want them to know? What do you want them to think about you?
Look first at how you already communicate information about employee remuneration to each of your key audiences. It’s unlikely to be your current website, and if it isn’t your website, think about how this single item on the gender pay gap is going to be perceived, both by your employees and by visitors to your site: would a revamp of your website (perhaps by creating a page devoted to gender pay gap initiatives) be helpful?
Provided you fulfil the regulatory requirement to publish your pay data on your organisation’s website in a manner that is accessible to employees and the public, it is up to you how you do this. You could, for example, present your gender pay gap report as part of an annual report, or on a people page. Wherever you choose to locate it, your search engine must be able to find it, and quickly.
Other well-used channels of communication might include: reports to shareholders, the board and senior management teams; annual reports, including those on corporate social responsibility; reports to membership bodies, especially those that are concerned with gender equality, such as Business in the Community; internal briefings and reports; the corporate intranet and other forms of communication with staff; media releases and corporate presentations aimed at external audiences. Think about how information about gender pay gap reporting will sit within each of these and how you can use them to meet your goals.
You also need to think about who needs to see the report before it goes on your own and the government website. This is not just about obtaining sign-off; it’s also about getting buy-in to your action plan.
Looking at external media, will you want a press release or media briefing? Are your employees likely to take to social media when the report becomes public?
Sequencing is important. You don’t want the press hearing about your headline figures before your employees do. It is for you to decide on the timing and sequencing, but it will probably go something like the flow chart in figure 4.
As with any form of publicity, there are risks. They include:
- Not understanding the gender pay gap – it’s important that your spokespeople understand what the gender pay gap is, how it differs from unequal pay, and how it plays out in your organisation. It’s also important that your employees understand what gender pay gap reporting is: its limitations (it doesn’t measure the extent to which men and women are getting equal pay), and why you are having to use six different measures.
- Inadequate data – if you are missing key data, say so, but also say what you intend to do to ensure this data is captured for future reports.
- Picking the wrong spokesperson – the choice of lead spokesperson is a key decision. It does not have to be the person who signs off the report and, if they are too busy, or in some way not the best person to talk about your gender pay gap issues, you can choose someone else. Make sure, whoever it is, that they are fully briefed and will be available when needed.
- Being unprepared for the obvious questions – even if you don’t think you are going to be questioned, it’s a good idea to be prepared. Draw up a Q&A and ask internal stakeholders for their input.
- Inconsistency with other public statements or with previous years’ gender pay gap reports – check what statistics you’ve previously presented on the gender pay gap. If they differ from what you’re now saying, you will need to be prepared to explain why this is.
Keep a record of your communications strategy and of any lessons learned and share these with your colleagues.
Closing your gender pay gap
The range
You are not required to report on it, but in the context of gender pay gap reporting, the range is your organisation’s pay dispersion, or the difference between the lowest hourly rate of pay and the highest. If the range is large, the mean or the median is not as representative of the data as it would be if the range was small, and so the greater your pay dispersion, the less reliable your calculations of the gender pay gap are.
The mean
The mean gives you an overall indication of the size of your gender pay gap and of your gender bonus gap. It also tells you something about how you manage pay in your organisation, especially when looked at in the context of the range.
A high mean gender pay gap, coupled with a high mean gender bonus gap and a large range, is often symptomatic of a payment system that tends to disadvantage women, so if this is what you are faced with, consider drilling down further into your payment system, for example, by checking for differences in starting salaries for men and women (both on recruitment, and on promotion), either by carrying out spot checks, or by implementing a full equal pay audit.
If your mean gender bonus gap is high, you may want to introduce gender monitoring of your performance appraisal system and examine the impact of managerial discretion on the award of bonuses.
The median
The median gives you an indication of what the ‘typical’ situation is, but, if your organisation has a complex pay system, there may not be a typical situation. By failing to take account, for example, of the impact on the gender pay gap of a small group of very highly paid employees, as the median isn’t affected by extreme figures, a median can give you a ‘false positive’, meaning that you don’t take the action necessary to close the gap.
If there is no typical situation in your organisation, gender monitoring of differences in pay outcomes is an essential safeguard against the risks of a gender pay gap that is out of control and of equal pay claims being raised. This means checking who is paid what by gender, noting the differences by gender and exploring the possible reasons for these. It may be, for example, that the reason for the gender gap (especially in industries previously regarded as typically male) is that the women, being relatively new, are younger and less experienced. On the other hand, these younger women may have better educational qualifications than their older male colleagues.
The mean and the median read together
The reason that the legislation requires both mean and median figures is to provide these different perspectives, so you typically need to consider both measures. When the mean and the median have the same or roughly the same value – for example, when the mean pay gap is 13%, and the median pay gap is 14% – the dataset is not skewed, and you can be reasonably certain that your employees, male and female, are being paid within the same income range, whatever that might be.
On the other hand, if the mean gender pay gap and the median gender pay gap are widely different, the dataset is skewed, either by the presence of very low earners (where the mean is below the median), and/or by a group of very high earners (where the mean is above the median). And if most employees in either of those groups of earners are mainly men or mainly women, a gender pay gap issue arises. In the context of gender pay gap reporting, we don’t only want to know what most people earn – the median – but also how the outliers affect the overall distribution of pay between men and women – the mean.
If the mean and the median are widely different, you may want to consider a range of initiatives, including checking the uptake of your flexible working arrangements, and taking action to break down occupational segregation.
Proportions
Comparing the proportions of men and women who receive a bonus within the 12-month period tells you how much more likely male full-pay relevant employees are to receive any amount of bonus payment compared with female full-pay relevant employees (and vice versa). If no bonuses have been paid to the relevant employees, the percentage figure will be zero.
In some organisations, the differences in cash value of a bonus awarded to a woman and a man may be explained by the distribution of part-time work. If you consider that your gender bonus gap has been skewed because a percentage bonus has been paid to full-time and part-time employees, you may want to explain this skewing in your narrative.
The comparative basis of a proportion is central to its usefulness as an indicator. The Regulations require you to report specifically on the proportions of men and women getting a bonus, and the proportions of men and women in each quartile pay band. In future years, you will also be able to track your progress by comparing your figures with those from previous years. This means you will be able to say, for example, that whereas in 2017, 25% of women received a bonus payment, by 2019 this had risen to 30%.
The Regulations ask you to report on the proportions of men and women receiving bonuses, and on the proportions of men and women in each quartile pay band, and to express these proportions as a percentage.
Quartiles
The quartile distribution is intended to give you information about the ‘glass pyramid’, or how the relevant full-pay male and female employees are distributed across your organisation. If men and women are not evenly distributed throughout the organisation, you may wish to check your recruitment and progression procedures and your flexible working arrangements (see below).
The calculation of the quartiles will also pick up on pay gaps at the top of the organisation, even if the mean and median figures have masked this.
Example: What quartile pay bands can tell you
Marten Materials manufactures industrial flooring. It has two sites, one in the northwest of England and another in the Scottish Borders. On the snapshot date it has 783 employees. The company is highly gender-segregated, with men designing, producing and delivering the products, and women performing the administrative work, servicing online sales and doing the cleaning and catering. Marten is aware of this segregation but has not thought it relevant to pay.
Its quartile pay band distribution across the two sites is as follows:
| Quartile | Women (%) | Men (%) |
| Upper | 2 | 98 |
| Upper middle | 20 | 80 |
| Lower middle | 50 | 50 |
| Lower | 90 | 10 |
Managers at the Scottish site express surprise at this distribution, and further analysis reveals that at the Borders site, gender segregation is much less pronounced, with a woman on the management team, and several women working in the production roles, which make up the upper-middle quartile pay band. The Borders site also has male cleaners. Scottish managers think that the differences may be down to the way in which the company recruits, in that the Borders site uses online recruitment and, when advertising through the local Jobcentre, does not assign the jobs to the ‘engineering’ section. Recruitment to the English site is largely by word of mouth. Marten decides to open up its recruitment procedures and monitor the impact of this on the quartile pay band distribution.
What action you take to close your gender pay gap is for you to decide. It will vary from one sector to another and from one business to another. Some organisations will need to focus on breaking down horizontal occupational segregation, others on getting more women into senior jobs. Some will want to carry out a full equal pay audit, others to improve take-up of flexible working at senior levels. In a guide such as this, it is not possible to be prescriptive, rather presenting a range of suggested actions.
Gender pay gap calculations may provide a clue as to the reasons for your pay gap, but are more meaningful if you have effective gender monitoring procedures in place related to the below areas of people management practice:
Recruitment and progression
You will need information on:
- The numbers of men and women who apply for, and are recruited or appointed to, each job type and level – women are disproportionately less likely to be promoted than men, and this can be so even where their performance ratings are the same as men’s or higher. If this is so, why is it happening?
- The skills, qualifications and experience of the men and women who apply for and those who are subsequently recruited or appointed to each job type and level – are you missing out on talented women? If so, what can you do to ensure they don’t get overlooked?
- How long it takes men and women to get promoted – evidence shows that men tend to get promoted more quickly than women. If this is so, why is it happening, and what can you do to even out the progression rates?
- The reasons why men and women leave the organisation – exit interviews may reveal information, such as women’s experiences of unwanted behaviour at work, which people may not be willing to disclose while they are still working for you. People may also give you feedback on how well your policies and practices, say in respect of flexible working, are operating.
Mapping this information against your gender pay gap calculations will enable you to see at what point in the process women are not getting into higher-earning jobs. Is it that they can’t move sideways, or up? Or that they can’t do this in enough numbers to be comfortable enough to want to stay? For example, one of the most severe talent shortages in coming years will be in the STEM sector, but despite the many efforts to address the shortfall of women, women still make up only 14% of the STEM workforce overall. As the issue is not one of girls’ competences, the fact that women disproportionately drop out of the pipeline at every stage suggests that cultural norms are putting women off.
Take-up and impact of flexible working
You will need information on:
- The numbers of men and women who apply for and are granted flexible working hours and the level of the organisation at which flexible working operates – if men are not applying, what can be done to encourage them to do so? If only low-level jobs are being carried out on a flexible basis, it is less likely that you will find men working flexibly, and more likely that women will be unable to progress up the career ladder.
- The numbers of partners who take paternity leave and the numbers of men and women who take shared parental leave – paternity leave and shared parental leave are intended to help redistribute responsibility for looking after infant children, thereby diminishing the impact of motherhood on a woman’s earnings and career.
- The proportion of women and men who return to work after maternity, paternity, adoption or shared parental leave to resume their original jobs – again, the intention behind these types of leave is that parenthood should not prejudice an employee’s career.
- The proportion of women and men still in post a year after a return to work from maternity, paternity, adoption or shared parental leave – employees may return but then find it difficult to manage and leave a year or two later. This is particularly likely to happen after the birth of a second or subsequent child, where the costs of childcare may become a decisive factor.
Mapping this information against all your gender pay gap calculations will enable you to see if your flexible working arrangements are having the effect that they are intended to. Family leave and flexible working arrangements are not about getting more women into more part-time jobs, but about giving employees choice about how to distribute the responsibility for looking after family members between themselves, so as to reduce the motherhood and eldercare pay penalties.
Reward
You will need information on:
- Starting pay for men and women, both on recruitment and on appointment to higher-paid roles – differences in starting pay are one of the most common causes of the gender pay gap, and are highly likely to represent instances of unequal pay. It would be advisable to look particularly carefully at how you reward experience. It’s all too easy to say that one person has more experience than another, but if challenged, could you explain what exactly you mean by ‘experience’ and how it justifies a difference in the calculation of your salaries – even if experience did once justify a difference, does it still do so?
- The allocation to men and women of any payments that are subject to managerial discretion – unfettered managerial discretion is a common cause of both the gender pay gap and unequal pay. If your bonus system is working properly, for example, it should reflect performance, not preference.
Mapping this information against your mean gender pay gap and all three measures of the gender bonus gap will give you a good idea of where pay inequalities are occurring. Inequalities in your reward system put you at high risk of equal pay claims being taken against you, and should be dealt with as a matter of priority.
All this additional information will support you to take actions that will result in:
- unpaid care being distributed more evenly between women and men
- the elimination of the occupational downgrading and career stalling that occurs when a woman becomes a mother
- all women, including those working part-time, being provided with opportunities for career progression and development on a par with those of their male colleagues
- the gradual elimination of occupational segregation, both horizontal and vertical
- a reward system that is free from gender bias.
In short, you are looking to enable women, just as much as men, to reach their full potential at work.
Gender pay gap reporting: Calculation examples
Example calculations for gender pay gap reporting
CIPD Trust
Tackling barriers to work today whilst creating inclusive workplaces of tomorrow.
Bullying
and harassment
Discover our practice guidance and recommendations to tackle bullying and harassment in the workplace.


Explore the CIPD’s point of view on religion and belief, including actions for Government and recommendations for employers

Explore the CIPD’s point of view on low pay and financial wellbeing, including recommendations for employers and actions for the UK Government


What this practice is, why you should avoid it, and how to approach it if no other options are available

Practical guidance to help employers create a carer-friendly workplace

Maximise the benefits of flexible working, incorporating flexibility into people plans, strategy, and EVP